NYC Marathon Pacing Analysis:
How 56,000+ Runners Fade
Data Science · K-means Clustering · 2024
Overview
A project very dear to me as I've spend 2 decades in NYC and am a marathon runner myself.
We engineered a scraper and analyzed 56,000+ finisher records from the NYC Marathon creating
the first ever dataset for the NYC 2025 TCS marathon data found here: HuggingFace.
Applied K-means clustering to pacing profiles (split times across 27 distance checkpoints) to discover
5 distinct runner archetypes from disciplined even-pacersto the 2.7% who hit the wall catastrophically.
The crisis zone: any runner who slows more than 20% from their starting pace by mile 20.
The 5 Pacing Archetypes
C1 — Even Pacer (25.9%)
Holds within ±5% of starting pace all the way through mile 26. Rare. The ideal.
C2 — Mild Slowing (37.2%)
Largest group. Gradually fades ~6% from starting pace. Still a solid race.
C3 — Moderate Slowing (23.1%)
Fades ~13%. Typically starts too fast and pays in the second half.
C4 — Significant Slowing (11.2%)
~20% fade. Entered the crisis zone. Likely walked significant portions.
C5 — Severe Crash (2.7%)
39%+ slowdown. Catastrophic wall — often associated with heat, injury, or significant overestimation of fitness.
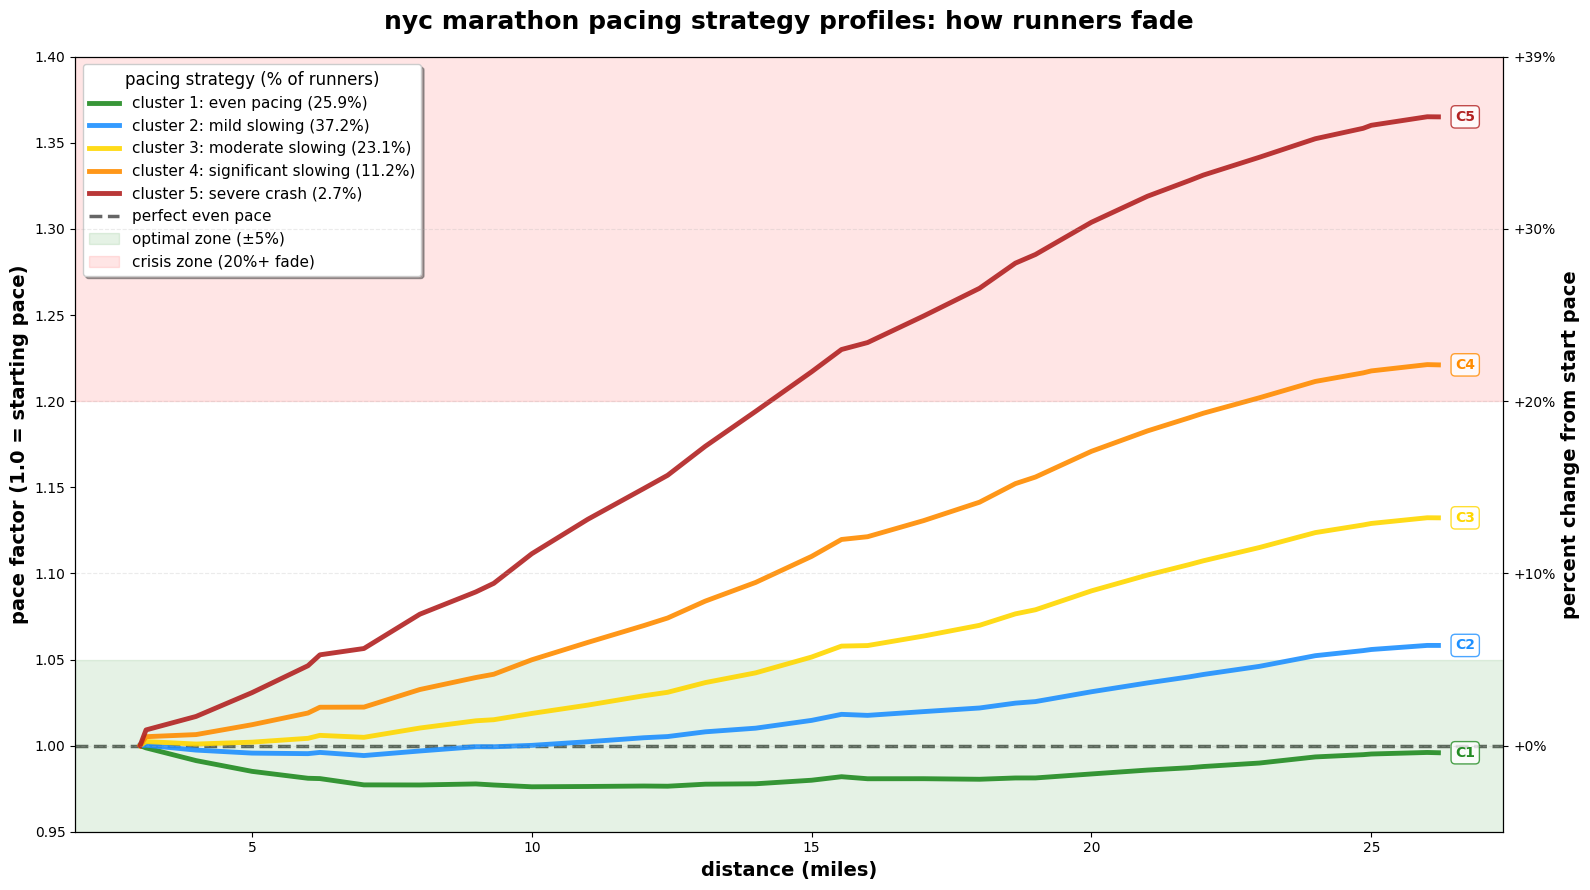
Figure 1. Pace factor (1.0 = starting pace) vs. distance in miles for each cluster. The green optimal zone (±5%) and red crisis zone (20%+) are shaded. C5 runners reach +39% slowdown by the finish.
Key Stats
56k+
Runner records
Scraped from official NYC Marathon results. Split times at 27 distance checkpoints per runner.
K = 5
Optimal clusters
Determined via elbow method and silhouette score on normalized pace curves.
2.7%
Severe crashers
Small but statistically distinct group — not a tail of C4, but a genuinely separate failure mode.